
|
2022-09-15 00:37
조회: 3,115
추천: 6
17~현제 넥슨 캐쉬 충전/사용내역 확인하는방법.17년~22년지금 넥슨에 캐시지른 금액 확인 방법.. https://www.inven.co.kr/board/maple/2299/8845734?vtype=pc 본문과 다른코드 ※넥슨 아이디 접속한상태로 주소이동 충전 /사용/ 철회내역에서 F12 클릭하여 Console 클릭하여 > 에 아래코드 복사 붙여넣기 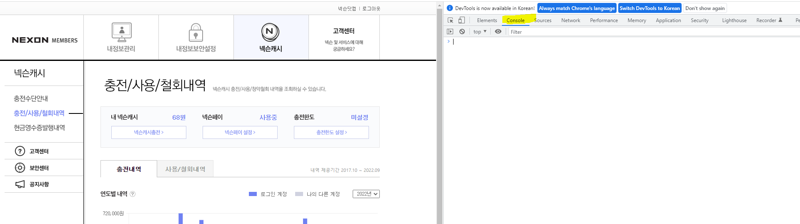 복사할 코드 이아랫부분만 복사해서 붙여넣기할것. -----부분은 복사하지않는다. --------------------------------------------------------------------------- const startAt = 'var data'; const endAt = ';'; function sleep(ms) { return new Promise((resolve) => { setTimeout(resolve, ms); }); } function tcomma(value) { return String(value).replace(/B(?=(d{3})+(?!d))/g, ','); } async function getAmount(option) { const { year, isUsed = false, includeOther = false, month = 12 } = option; return new Promise((resolve) => { $.get(url, { pagecode: isUsed ? 2 : 1, year, month, }, function(response){ const startIdx = response.indexOf(startAt); const endIdx = response.indexOf(endAt, startIdx); const usedString = response.substr(startIdx + (startAt.length+1), endIdx - startIdx); let used = usedString.split(',').reduce((prev, curr) => prev + Number(curr.replace(/[^0-9]/g, '')), 0); if (includeOther && !isUsed) { const secondStartIdx = response.indexOf(startAt, endIdx); const secondEndIdx = response.indexOf(endAt, secondStartIdx); const secondUsedString = response.substr(secondStartIdx + (startAt.length+1), secondEndIdx - secondStartIdx); const secondUsed = secondUsedString.split(',').reduce((prev, curr) => prev + Number(curr.replace(/[^0-9]/g, '')), 0); used += secondUsed; } resolve(used); }); }); } function drawChart(data) { const chart1 = []; const chart2 = []; const chartColumns = []; let maxAmount = 0; let totalUsed = 0; let totalCharged = 0; const tableHeader = document.querySelector('.cashListWrap table thead'); const tableBody = document.querySelector('.cashListWrap table tbody'); tableHeader.innerHTML=''; tableBody.innerHTML=''; const thead = document.createElement('tr'); thead.innerHTML = '<th>번호</th><th>연도</th><th>충전/사용</th><th>금액</th>'; tableHeader.appendChild(thead); let idx = 1; for(const [year, amount] of data.entries()) { chartColumns.push(`${year}년`); chart1.push(amount.used); chart2.push(amount.charged); maxAmount = Math.max(maxAmount, amount.used); maxAmount = Math.max(maxAmount, amount.charged); totalUsed += amount.used; totalCharged += amount.charged; const chargedRow = document.createElement('tr'); chargedRow.innerHTML = `<td>${idx}</td><td>${year}년</td><td>충전</td><td>${tcomma(amount.charged)}원</td>`; tableBody.appendChild(chargedRow); idx += 1; const usedRow = document.createElement('tr'); usedRow.innerHTML = `<td>${idx}</td><td>${year}년</td><td>사용</td><td>${tcomma(amount.used)}원</td>`; tableBody.appendChild(usedRow); idx += 1; } const totalRow = document.createElement('tr'); totalRow.innerHTML = `<td class="totalTxt" colspan="2"><span>총합<span></td><td>충전: ${tcomma(totalCharged)}원</td><td>사용 ${tcomma(totalUsed)}원</td>`; tableBody.appendChild(totalRow); const option = { animate: false, seriesColors: ["#6f81f2","#d0d2e0"], seriesDefaults: { renderer: $.jqplot.BarRenderer, pointLabels: { show: false }, rendererOptions: { barWidth: 10 }, shadow: false }, axes: { xaxis: { renderer: $.jqplot.CategoryAxisRenderer, ticks: chartColumns, tickOptions: { showGridline : false } }, yaxis: { max: maxAmount, numberTicks: 10, min: 0, tickOptions: { formatString: "%'d원" } } }, axesStyles: { borderWidth: 0 }, axesDefaults: { tickRenderer: $.jqplot.CanvasAxisTickRenderer, tickOptions: { fontSize: "10pt", fontFamily: "'돋움', 'dotum', 'Trebuchet MS', 'Lucida Grande', 'Tahoma', 'Helvetica', 'Arial', sans-serif" } }, grid: { backgroundColor: "white", borderWidth: 0, gridLineColor: "#EEEEEE", gridLineWidth: 1, borderColor: "#EEEEEE", shadow: false }, highlighter: { show: true, useAxesFormatters: false, tooltipAxes: "y", tooltipFormatString: "%'d원" } }; $.jqplot("graphCharge", [chart1, chart2], option); } async function work(includeOther) { document.getElementById('graphCharge').innerHTML = ''; document.querySelector('.graphInfoSec .userType .user1').innerText = '충전금액'; document.querySelector('.graphInfoSec .userType .user2').innerText = '사용금액'; const data = new Map(); const nowYear = new Date().getFullYear(); const nowMonth = new Date().getMonth() + 1; for(let target=2017; target < nowYear; target += 1) { data.set(target, { used: await getAmount({ year: target, isUsed: true, includeOther, }), charged: await getAmount({ year: target, includeOther, }), }); await sleep(1000); } data.set(nowYear, { used: await getAmount({ year: nowYear, isUsed: true, includeOther, month: nowMonth, }), charged: await getAmount({ year: nowYear, includeOther, month: nowMonth, }), }); drawChart(data); } work(true).catch(console.log);  네 지옥을 맛봤습니다 ...혼자만 맛볼수가 없... |
 리아세이츠
리아세이츠 


인벤 공식 미디어 파트너 및 제휴 파트너


인포메이션
명칭: 주식회사 인벤 | 등록번호: 경기 아51514 |
등록연월일: 2009. 12. 14 | 제호: 인벤(INVEN)
발행인: 박규상 | 편집인: 강민우 |
발행소: 경기도 성남시 분당구 구미로 9번길 3-4 한국빌딩 3층
발행연월일: 2004 11. 11 |
전화번호: 02 - 6393 - 7700 | E-mail: help@inven.co.kr
인벤의 콘텐츠 및 기사는 저작권법의 보호를 받으므로, 무단 전재, 복사, 배포 등을 금합니다.
Copyrightⓒ Inven. All rights reserved.
인터넷 신문 위원회 배너
2023.08.26 ~ 2026.08.25
인벤 온라인서비스 운영
(웹진, 커뮤니티, 마켓인벤)
▲
(주)인벤 사업자등록번호 : 120-86-74756
대표전화 : 02-6393-7700
FAX : 02-6393-7706
인벤의 콘텐츠 및 기사는 저작권법의 보호를 받으므로, 무단 전재·복사·배포 등을 금합니다.
Copyright © Inven Communications. All rights reserved.
대표전화 : 02-6393-7700
FAX : 02-6393-7706
인벤의 콘텐츠 및 기사는 저작권법의 보호를 받으므로, 무단 전재·복사·배포 등을 금합니다.
Copyright © Inven Communications. All rights reserved.